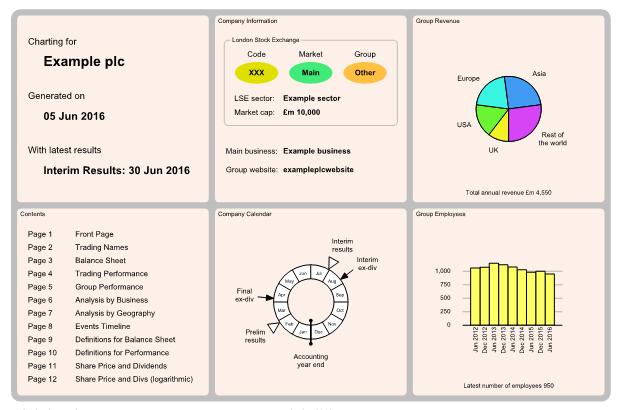

Top left box shows company name, date this chart was generated and which latest results are incorporated. Check you have latest results.
Stock exchange information about this company including approx market capital. Also shows main business activity and group website address.
Top right box shows sources of revenue geographically for the group, if known. For some companies, such data may be missing.

Bottom left box shows list of pages in charting document.
Company calendar annual cycle, showing "at a glance" when to expect next results. Also shows when shares become ex-dividend, if applicable. Dividends typically paid a few weeks after ex-div.
History chart of number of employees for the group, for indication of "size" of the group and whether expanding. Data may be found in results documents or group website, but may be missing.