

Charting documents consist of 12 pages of charts and other information as shown below. Images are taken from the Example charting document. You may want to navigate to the Example document first to see the images full size, which you may find easier to read.
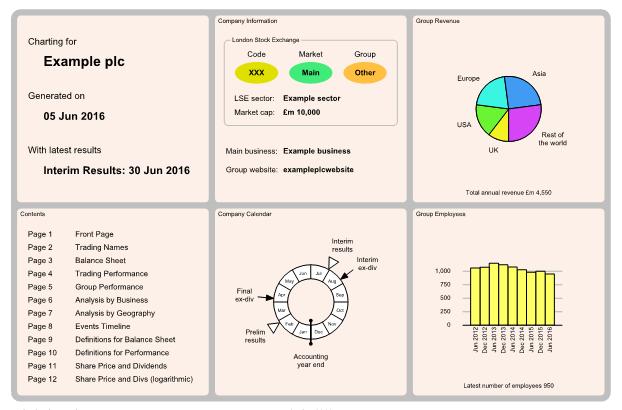
General information such as stock market capitalisation, principle manufactured product or service provided, dates of results and ex-dividends.
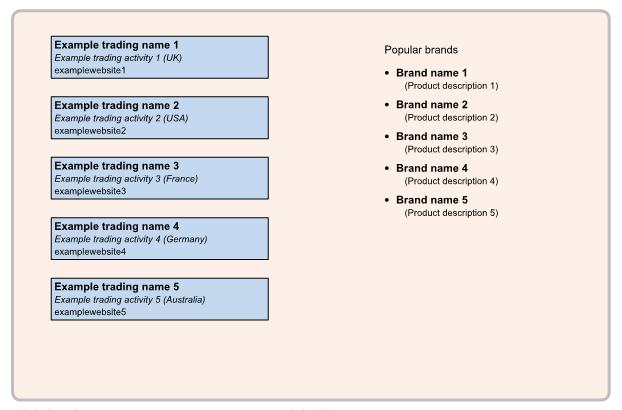
List of main trading names and main product brands if applicable.
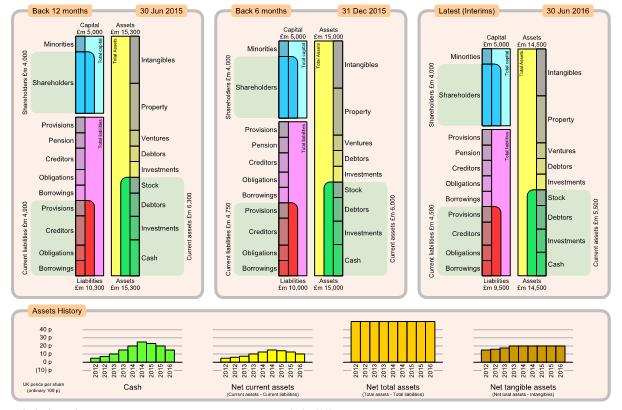
Financial position of the company showing assets against liabilities and capital.
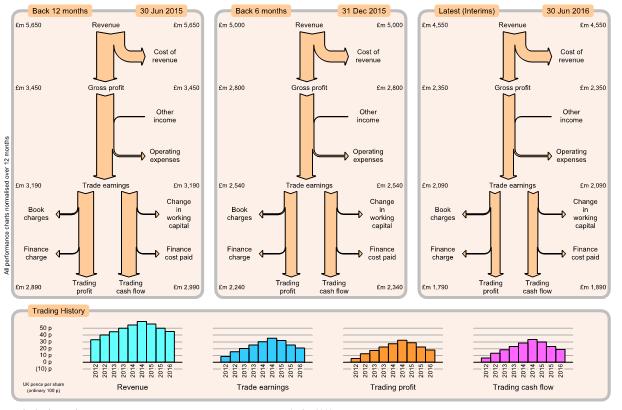
Profit flow and cash flow of income and expenditure for normal trading activities.
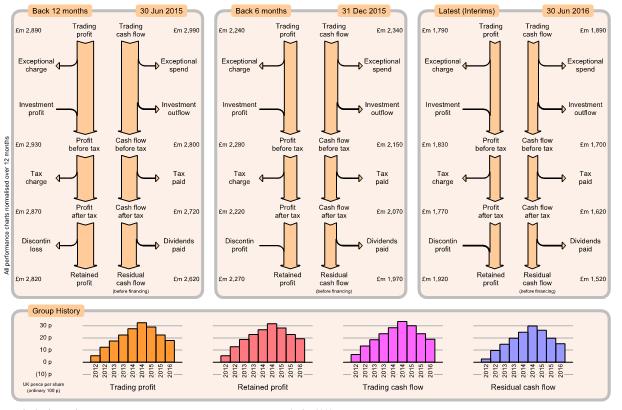
Profit flow and cash flow of income and expenditure for non-trading activities such as investment, exceptional costs, tax and dividend payments.
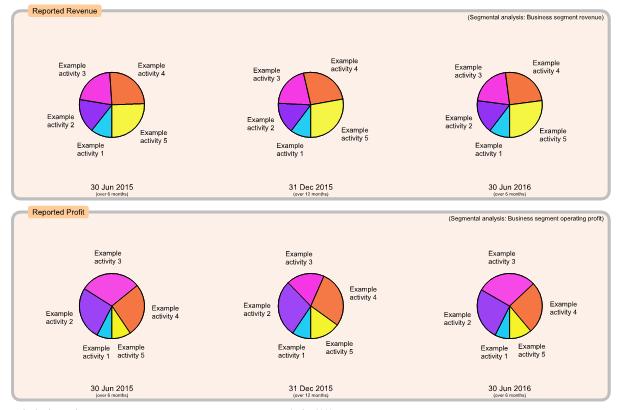
Pie charts showing sources of revenue and profit analysed by business activity.
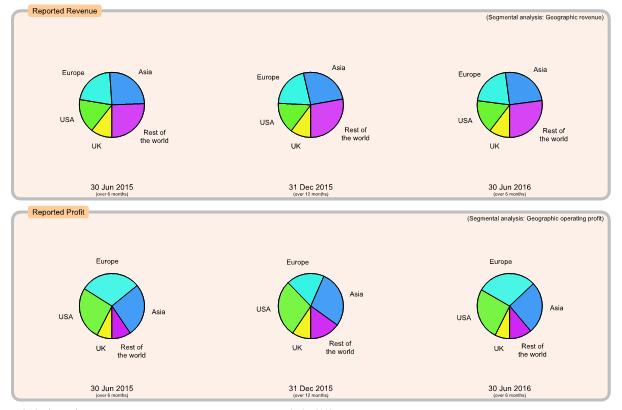
Pie charts showing sources of revenue and profit analysed by geographical region.
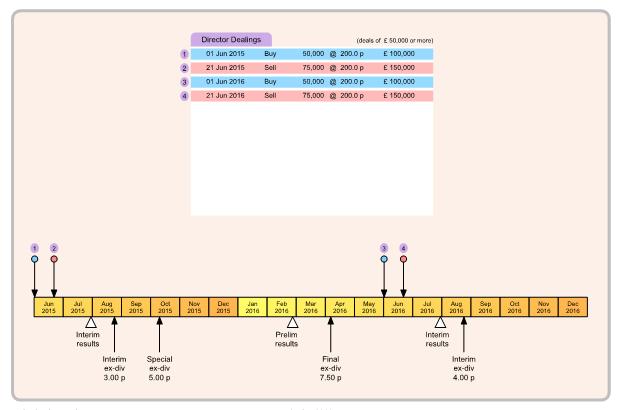
Timeline of recent past and future events such as announcement of results, ex-dividend dates and director dealings.
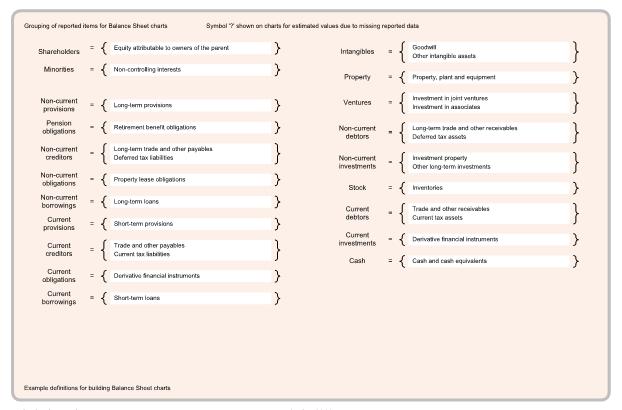
Definitions of groupings of reported items used for generating Balance Sheet charts.
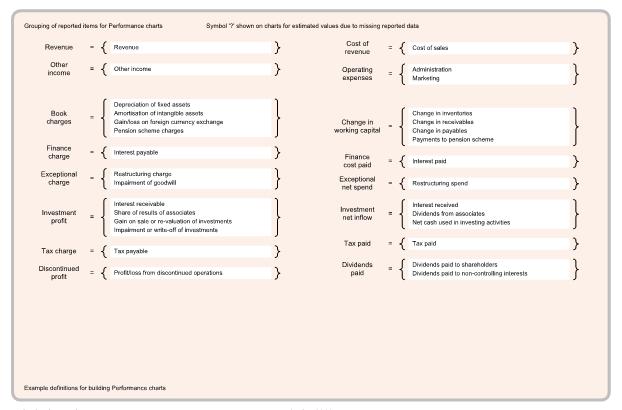
Definitions of groupings of reported items used for generating Trading Performance and Group Performance charts.
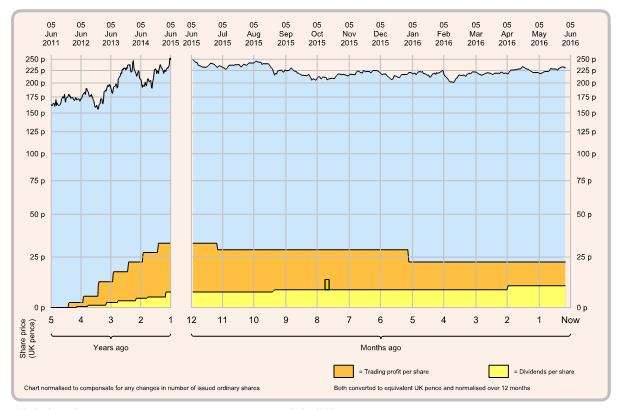
Graph of share price over last 5 years along with dividend payments and comparing with trading profit.
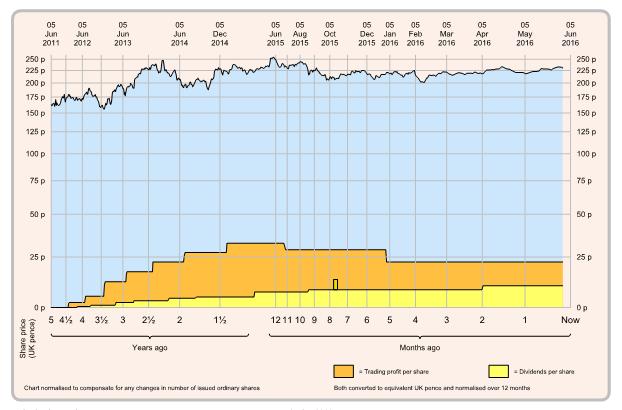
Graph of same information as page 11 but presented with a logarithmic time scale to show smoothly expanding detail.