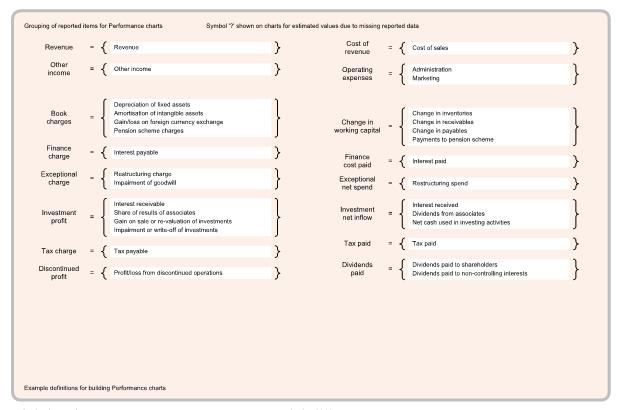

This page presents definitions used to generate the Trading Performance and Group Performance charts in the document. These definitions show how the chart values are derived from the company's results. Aiming for consistency by choosing appropriate items from a company's reports so that charts can be compared between different companies.
Items normally extracted from the reported Consolidated Income statement and Cash Flow statement.

Occasionally, some degree of judgement is applied when deciding which item should go in which chart component group as reported data may be incomplete or missing. For example, it may be uncertain whether an expense should be classed as Cost of revenue (cost of making or selling the product or service) or Operating expenses (cost of running the business).
It may be necessary to estimate items where data are missing from the company's report. For example, details may be missing in reported cash flow and estimates may be needed for items in Book charges and Change in working capital.