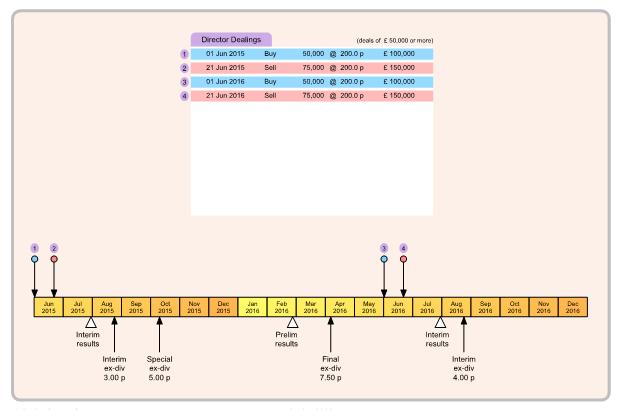

Top box shows list of recent large director dealings. Directors have inside knowledge of the company: their decisions to buy or sell significant numbers of shares may provide some insight to the company's future prospects. These director dealings are also marked on the timeline (marks above the line) so you can easily see the relationship with other company events.
Be aware that while director buys may show confidence in the future of the company, director sells may be due to personal financial circumstances such as to pay a large tax bill or to exercise share options and may not indicate any undue pessimism in the company. For some companies, director sells may be frequent and large without any particular significance for investors.

Timeline of recent past and future significant events for the group. Time runs from left (in the past) to right (into the future), covering around 18 months. Director dealings (if any over this time period) are marked above the timeline. Publication dates of results and ex-dividend dates (if applicable) are marked below the timeline.
From the timeline you can easily see when the next results will become available or when the company's shares go ex-dividend. It may be advantageous to buy or sell shares before or after such events.
Question marks (?) indicate any estimated dates, typically based on dates from the previous year. An estimate may later be revised if the company announces a date for the future event (such as a result).